|
|||||||
Creating an Earth System II:
The Greenhouse Effect |
|||||||
2. The Enhanced Greenhouse Effect and Global WarmingAtmospheric concentrations of greenhouse gases have increased significantly since the Industrial Revolution due to human activities (fossil fuel combustion, deforestation, raising livestock, coal mining and drilling for oil and natural gas, rice cultivation, decomposition of garbage in landfills). See the EPA global warming website for lots of depressing news. Global warming, the progressive rise of the Earth’s surface temperature, almost certainly causes changes in global climate patterns. Earth has undergone many periods of global warming (and others of global cooling) due to natural causes, so how do we know whether, and how much, humans have contributed to the current episode (about 100 yr old) of global warming? Geologists study paleoclimates (literally, ancient climate) by investigating proxies that are sensitive to climatic variables, such as temperature and precipitation, e.g. tree rings, ice cores, marine sediments, and fossil pollen. Long-lived ice masses, called glaciers, are storehouses of old air. Ice starts out as layers of snow, a light fluffy material mixed with air. As snow layers accumulate, their weight compresses the bottom layers, forming ice that traps some bubbles of “stale” air. The cyclicity of snowfall and snowmelt produces layers that can be counted like tree rings to provide an icy chronology.
In the image above, note the correlation between elevated temperatures and elevated levels of CO2. CO2 fluctuates naturally, but monitoring since the late 1950s shows a true enhanced rate of CO2 concentrations. Scientists have drilled deep into the Greenland and Antarctic ice sheets, extracting cores that represent thousands of years of precipitation. There is a clear connection with human influence.
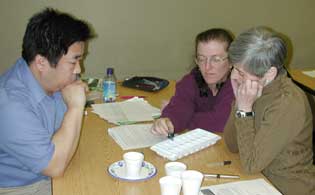
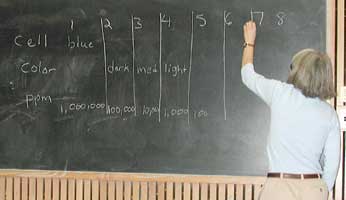
Activity: What Do Concentrations Mean? Comparing Concentration of Gases in Our AtmosphereIn this activity, students explore how many dilutions it takes to achieve a parts-per-million dilution of a common substance (food coloring). This can provide a basis on which to better understand concentrations of gases in our atmosphere that refers to parts per million. Please note: the table of gas and PPM illustrated within the teacher resource is out of date. The more appropriate PPM for CO2 is 370.
Despite the amount of data on the enhanced greenhouse effect, some continue to argue that climate change is influenced by changes in the solar cycle. To learn more go to Page 3... Return to Page 1.
|
|||||||
|
Return to: Creating an Earth System II | Dynamic Earth Homepage | UCMP Homepege |
|||||||