return to
What's Current
Classroom activity:
Mapping the Buoys
In order to further explore the horizontal movement of currents, such as the kind we see in ocean surface currents, we performed the following exercise that was modified from an SFSU oceanography lab course activity designed by Professor Karen Grove.
http://virga.sfsu.edu/courses/geol103/labs/currents/part1.html
Materials:
Copy of the data table
Copy of the Pacific Ocean Map
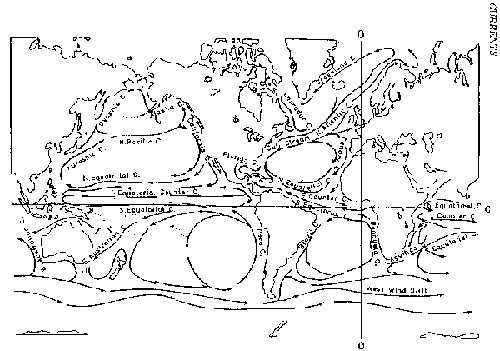
Map of Surface Currents
Procedures:
What patterns do we see in real ocean circulation data that can help us understand some of our models and the questions they raise about the complexity of real ocean currents?
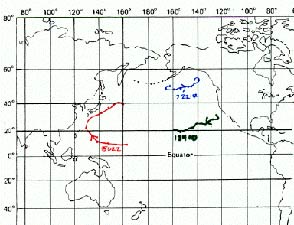
1. The groups plotted the 1995 data from 3 buoys in the North Pacific (Table 1. NORTH PACIFIC BUOY DATA, on the maps of the Pacific Ocean.)
|
|
Using longitude and latitude data to plot the position of each buoy location during the year, the groups then connected the locations with lines and drew an arrow to show the direction of motion. |
|
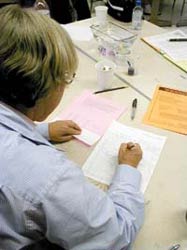
2. The teachers then presented their plots: |
 |
Results:
A brief discussion about the patterns observed with the buoy data followed. The teachers noted that the currents make a loop in the North Pacific and they were asked to compare their data with the larger pattern of surface currents in the ocean (Map of Surface Currents).
The teachers pondered the following questions to be addressed further during Session #2 on November 2, 2002:
-
What is moving the water?
-
How are winds, such as the trade winds related to the pattern of surface current circulation?
-
How does unequal heating with latitude drive convection cells in the atmosphere and ocean?
-
What role does the Coriolis effect play in the pattern of oceanic and atmospheric circulation?
Return to: What's Current | Dynamic Earth Homepage | UCMP Homepege