


Brachiopoda: Fossil Record
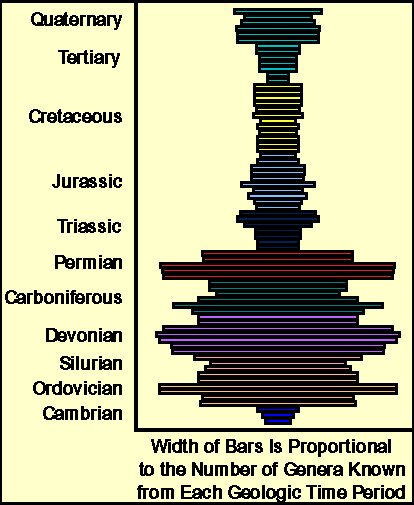
The above chart is called a spindle diagram.
This sort of diagram is used by the paleontologist to gain an
understanding of how diverse a group of organisms has been through
geologic time. On one axis of the chart is time, from the Cambrian
at the bottom to today at the top. The bars indicate
how many different kinds of brachiopod fossils that have been found by
paleontologists during each time period.
Look at the spindle diagram. What does it tell you?
Well, it tells you that brachiopods were most diverse during the
Devonian
period. The widest bar represents just over 200 different
genera that have been found for that time. The chart also shows you
that the brachiopods were much more diverse and numerous during the
Paleozoic
era, which corresponds to the periods Cambrian, Ordovician,
Silurian, Devonian, Carboniferous and Permian. Between the Permian
and the Triassic there is a drastic drop in the number of brachiopods.
In fact, the fossil records of many animal groups show this enormous
die off, giving the boundary the following name: The Permo-Triassic
mass extinction. This was the largest of all extinction events, killing
nealy 90 percent of all species alive at the time. The diagram also
shows you that brachiopods have never been as diverse since that event.
Fossil Range Chart of Brachiopods
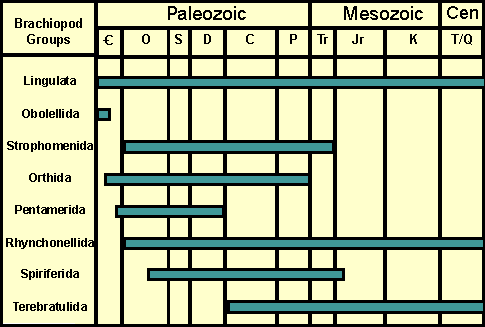
The above chart is mapped. You can go directly to each of the major brachiopod groups.