California has more than 26 oak (Quercus) species, many of which have widespread distributions and different habitats. For example, the California black oaks (Q. kelloggii) are distributed in foothills and low mountains (altitude ~4750 feet), while the Coast live oak (Q. agrifolia; altitude ~830 feet) lives near the coast. Palynologists study the distribution of plant pollen and spores in space and time, and changes in their assemblages reflect changes in regional and local vegetation.
In the study of past climates, palynologists have used oak pollen as an indicator of relatively warm environments. But in the examples given above, we see that the range of different oak species varies, so the temperatures in their respective habitats must vary as well. If palynologists treat all the oak species the same — as indicators of a “warm environment” — could this lead to wrong interpretations of the environmental conditions? If the answer is yes, why do palynologists still treat all the oak species the same?
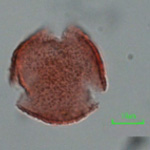
This question could be answered if we resolve a basic problem in pollen taxonomy: how to distinguish between the pollen of different oak taxa. All oak pollen have similar characteristics: three colpi (furrows) and a verrucate surface (small surface features under two microns). Even the ratio of length and width of each species overlaps. These nearly uniform morphological features make identifying oak pollen very difficult at the species level, at least using Light Microscopy (LM).
I am studying pollen samples from Clear Lake to understand climate and vegetation change in California during the last interglacial period (~120-80 kyr ago). See earlier blogs: Dispatches from Clear Lake, part 1 and part 2; California pollen taphonomy and pollen trap study in Clear Lake, California. After studying the lower part of a 150-meter-long lake core that includes sediments from the interglacial period I’m interested in, I found two distinct oak pollen numerical peaks. Before categorizing all oak pollen in the samples as “indicators of warm environments,” I would like to know which species of oak they represent. Since it’s so difficult to detect morphological differences using Light Microscopy, I wondered if I could identify more diagnostic features on pollen grains using Scanning Electron Microscopy (SEM). Serendipitously, a paper was published on how to use SEM and quantitative analysis to identify grass pollen at the species level. Like oak pollen, grass pollen is also difficult to differentiate using LM identification. Thinking that the methods described in the article could be applied to oak pollen identification, I decided to take SEM images of California oak pollen to see if a systematic identification method could be developed. Then, I’d use quantitative analysis methods to identify the oak species in my Clear Lake interglacial samples and see if there were particular taxa appearing and/or disappearing in the area during times of climate change.
Last summer (July, 2014) I visited Dr. Luke Mander, author of the grass pollen paper, at the University of Exeter, UK, to investigate the possibility of identifying oak pollen using SEM and computer statistics. In an SEM lab, I took 70 images of pollen from 23 extant California oak taxa and 150 images of fossil California oak pollen.

A preliminary analysis has already revealed that at least three pollen wall morphotypes, two of which represent habitat-specific oak types, can be recognized in extant California oak species. Most specimens in Type-1 represent shrub oaks, adapted to dry environments. Type-3 pollen neatly matches specific phylogenetic lineages. We were able to assign the fossil oak pollen from Clear Lake to the three categories of extant California oak pollen. Interestingly, the change in oak pollen groups in Clear Lake sediments suggests species replacement during the start of the interglacial period. I have found that more precise and objective identification of oak pollen types is possible using automated digital image analysis algorithms and a larger training set of SEM photographs of pollen from known species, so I will be working on that in the Fall. I hope to amass more detailed vegetation analyses for past periods of climate change.
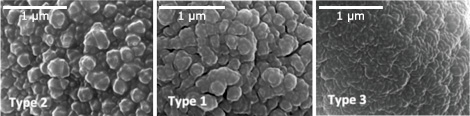
All photos courtesy of Winnie Hsiung.