 In science we are often confined to studying processes that occur on local scales. This is a natural place to begin and there is great value in understanding local events and processes, but the ultimate goal, at least in my mind, is to synthesize all these smaller snapshots of how living things interact and respond to their environments into a cohesive, whole-world portrait. This kind of comprehensive understanding is particularly important in light of global climate change, which demands that we develop conservation strategies that address broader issues than conservation has in the past. The “Holy Grail,” in this regard, would be data covering the whole earth and all taxa, throughout the history of life. Regretfully, this is unlikely to ever be fully realized; however, there has been a recent blossoming of databases, containing all kinds of biological data from across the globe that begins to build toward this overarching ambition. Of particular relevance to paleontologists is the Neogene Mammal Mapping Portal (NeoMap), which holds records of mammalian fossils from the last 30 million years in North America.
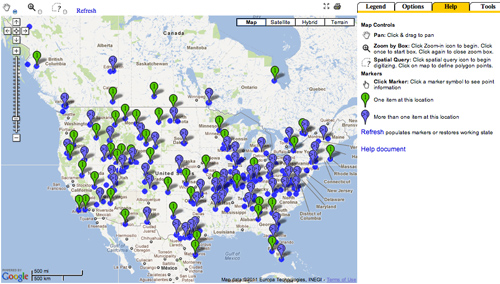
NeoMap unifies two free-standing, open-access databases—the Miocene Mammal Mapping Project (MioMap)2, hosted by the UCMP, and the Quaternary Faunal Mapping Project (FAUNMAP)3,4—and enables the user to access and download any published (and some unpublished) data on fossil mammals (along with complete metadata), to map the localities where these fossils were collected, and to generate tables of species abundances (minimum number of individuals). These tables can be easily modified for more specific purposes, for example, to estimate species/area relationships or to assemble a taxonomic list for an entire region during a given period of time. This means that research addressing a wide variety of macro-scale questions is now possible using NeoMap—previously, these kinds of projects were prohibitively laborious, because they required extensive and exhaustive literature searches followed by painstaking data standardization.
A recent example of the utility of NeoMap is described in a book chapter by Tony Barnosky (UCMP), Marc Carrasco (UCMP), and Russell Graham: Collateral mammal diversity loss associated with late Quaternary megafaunal extinctions and implications for the future (chapter in “Comparing the Geological and Fossil Records: Implications for Biodiversity Studies”1). This paper explores whether all of the biodiversity loss exhibited by mammals at the end of the Pleistocene can be explained by extinction of megafauna. The authors found that over and above the loss of large mammals that went extinct, there was local and regional loss of diversity because geographic ranges of species got smaller. That “collateral diversity loss” resulted in an additional 6-51% diversity reduction, depending on location, that was on top of species loss by extinction. This collateral loss affected small mammals even more than large mammals1. The bottom line is that extinction is only one symptom of diversity loss, and local or regional extirpations compound and intensify the massive ecological changes that take place during biodiversity crises like the one we are experiencing today.
This project illustrates two tools that make NeoMap so powerful: paleo-areas were drawn and measured in NeoMap using the BerkeleyMapper utility, and species presence/absence tables were generated using the MioMap EstimateS Web Service, which queries all the points selected in BerkeleyMapper and returns the data as a sites-by-species table. In my own work, fellow UCMP grad student Michael Holmes and I have used NeoMap to study how the distribution of species in different body size and diet functional groups has changed through time in the Northern Great Plains. Our analysis has shown remarkable stasis in the relative number of species in each functional group across millions of years, except during two periods of rapid climate change: the end of the Mid-Miocene Climatic Optimum, and the Pleistocene/Holocene transition5.
To use the database, learn more about it, or read about other examples of research using NeoMap, go to http://www.ucmp.berkeley.edu/neomap/.
References:
1. Barnosky, A.D., Carrasco, M.A., Graham, R.W., 2011, Collateral mammal diversity loss associated with late Quaternary megafaunal extinctions and implications for the future. Comparing the Geological and Fossil Records: Implications for Biodiversity Studies. Geological Society, London, Special Publications. 358:179-189
2. Carrasco, M.A., Kraatz, B.P., Davis, E.B., Barnosky, A.D., 2005. Miocene Mammal Mapping Project (MIOMAP). University of California Museum of Paleontology http://www.ucmp.berkeley.edu/miomap/
3. FAUNMAP Working Group, 1994. FAUNMAP: a database documenting late Quaternary distributions of mammal species in the United States. Illinois State Museum Scientific Papers 25(1-2):1-690.
4. Graham, R.W., and E.L. Lundelius, Jr., 2010. FAUNMAP II: New data for North America with a temporal extension for the Blancan, Irvingtonian and early Rancholabrean. FAUNMAP II Database, version 1.0.
5. Stegner, M.A. & Holmes, M., 2011. Using paleontological databases to assess spatial and temporal conservation of mammalian community structure as an aid to conservation planning. Society of Vertebrate Paleontology Meeting, Las Vegas, NV.

