INTERPRETING PALEOENVIRONMENTS
WITH MICROFOSSILS
STEPHEN J. CULVER
INTRODUCTION
ONE OF the basic tenets of geology is the present is the key to the past . In
the present context this simply means that if we document the distribution of organisms today, and have some degree of understanding of what combination of environmental variables controls those
distributions, then we can use this information to reconstruct past environments by using the fossilized representatives of the modern organisms as paleoenvironmental indicators. This classic use of microfossils, along with biostratigraphy, is of great significance in the search for oil and gas.
In recent years, however, with an increased awareness of how humans are affecting the natural world, in many cases for the worst, micropalaeontologists are increasingly turning that basic tenet around to the past is the key to the future . In other words,if we can understand how organisms in the past responded to environmental changes then we can use
that information to predict how future natural or anthropogenic environmental change might affect the Earth s biota.
Interpreting palaeoenvironments with Microfossils is, therefore, a topic
that demonstrates the relevance of these aspects of paleontology. It shows how knowledge obtained via study of modern organisms can be used to infer environmental conditions in the past. It also demonstrates the predictive side of science; for example, what might happen if a particular pollutant is introduced to an estuary, or, on a much larger scale, what might happen to coastal ecosystems if sea-level rose as a result of anthropogenic global warming and subsequent collapse and melting of polar ice sheets.
BACKGROUND INFORMATION
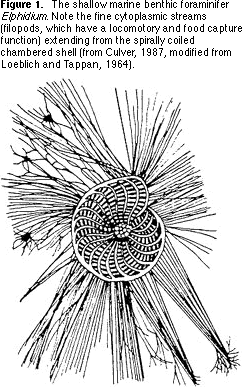
The organisms utilized in this lesson are Foraminifera (Figure 1) or forams for short. These are protozoans (single-celled animals generally the size of a sand grain) with shells that are usually either composed of secreted calcium carbonate (calcareous forams) or of sediment
particles collected by the organism from the surrounding environment
(agglutinated forams).
 Foraminifera live in all marine environments from the deepest ocean floor to the intertidal salt marshes that are found behind barrier islands or around the margins of estuaries. Different kinds of foraminifera inhabit different environments — this is the
simple fact that allows paleontologists to use forams as paleoenvironmental indicators. For example, some species (planktonic) float in the upper layers of the ocean s waters whereas other species
(benthic) live on the sea bed or just beneath the sediment surface. If a
paleontologist studying ancient sediments of unknown origin finds that they contain an assemblage of forams that is composed mainly of planktonic species then he or she will make the interpretation (based on the concept that the present is the key to the past) that the sediment was deposited in an open ocean well away from land.
Foraminifera live in all marine environments from the deepest ocean floor to the intertidal salt marshes that are found behind barrier islands or around the margins of estuaries. Different kinds of foraminifera inhabit different environments — this is the
simple fact that allows paleontologists to use forams as paleoenvironmental indicators. For example, some species (planktonic) float in the upper layers of the ocean s waters whereas other species
(benthic) live on the sea bed or just beneath the sediment surface. If a
paleontologist studying ancient sediments of unknown origin finds that they contain an assemblage of forams that is composed mainly of planktonic species then he or she will make the interpretation (based on the concept that the present is the key to the past) that the sediment was deposited in an open ocean well away from land.
 Return to top Return to top
Paleoenvironmental interpretations are made possible by recognizing several kinds of patterns in foraminiferal assemblages.
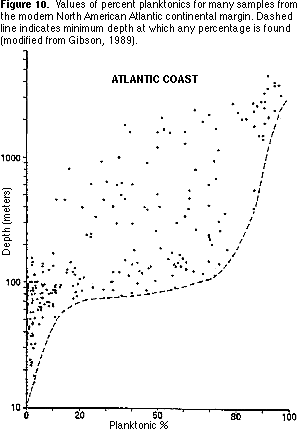
Percent planktonics — The proportion of planktonic specimens increases from 0 percent in shallow marine environments to more than 90 percent in deep marine environments. Modern planktonic forams generally have globular chambers, often with spines. Some fossil planktonics, however, particularly in the Cretaceous, had a more flattened shape, sometimes with heavy keels running around the shell.
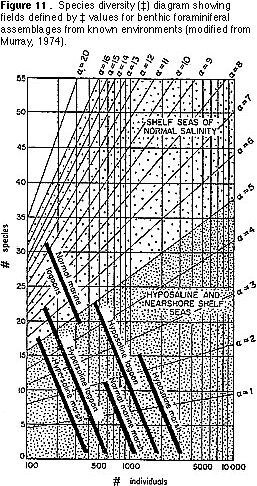
Species diversity — This is simply the number of benthic species in a standard-sized sample. The general pattern recognizable in marine environments today is of increasing diversity away from shore (i.e., with increasing water depth) (Figure 2).
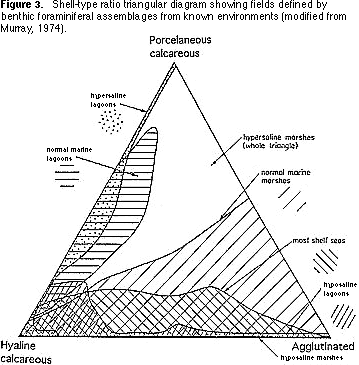
Shell-type ratios — Benthic foraminifera can be agglutinated or calcareous. Calcareous species are divided into those whose shells have a clear or translucent appearance (hyaline) with tiny perforations (pores) and those whose shells are white and opaque and have no perforations (porcelaneous). The proportions of these three types of walls (agglutinated,
hyaline, porcelaneous) in a sample of foraminifera is also characteristic of
particular environments in modern seas and oceans (Figure 3). For example, assemblages characterized by high proportions of agglutinated taxa are found in intertidal marshes. Assemblages dominated by porcelaneous species characterize shallow tropical environments.

Return to top
Taxonomic approach — This is the methodology that results in the most detailed interpretations. It involves the inference of palaeoenvironments based on the known environmental preferences of modern species or genera. Because it involves the exact identification of species, this approach is the most challenging, even for experts who have
studied foraminifera for many years.
These four approaches to paleoenvironmental interpretation have been used
for several decades by oil company paleontologists. When an oil well is drilled, rock fragments are brought to the surface and among these fragments are often hundreds of specimens of foraminifera. Paleoenvironmental interpretations of assemblages from increasing depths in the well represent interpretations of older and older rocks. These changes in environment through time can be recognized in adjacent wells (via the process of correlation) and so a three-dimensional picture can be constructed of the various layers of rocks and paleoenvironments penetrated by the wells. This then allows the paleontologist to predict
where oil or gas is most likely to be encountered. A further well can then be
drilled to test that prediction (usually with negative results!).
Return to top
USEFUL REFERENCES
Culver, S.J. 1987. Foraminifera, p. 169-212. In T.W. Broadhead, Fossil
Prokaryotes and Protists. Notes for a Short Course, University of Tennessee, Department of Geological Sciences, Studies in Geology 18.
Douglas, R.G. 1979. Benthic foraminiferal ecology and paleoecology, a
review of concepts and methods, p. 21-53. In J.H. Lipps, W.H. Berger, M.A. Buzas, R.G. Douglas and C.A. Ross, Foraminiferal Ecology and Paleoecology, Society of Economic Paleontologists and Mineralogists, Short Course 6.
Gibson, T., and M.A. Buzas. 1973. Species diversity: patterns in modern and
Miocene foraminifera of the eastern margin of North America. Geological Society of America Bulletin, 84: 217-238.
Gibson, T.G. 1989. Planktonic-benthonic foraminiferal ratios: modern
patterns and Tertiary applications. Marine Micropalaeontology, 15: 29-52.
Haynes, J. 1981. Foraminifera. John Wiley and Sons, New York, 433 p.
Loeblich, A.R., Jr., and H. Tappan. 1964. Sarcodina chiefly Thecamoebians
and Foraminifera. In R.C. Moore, ed., Treatise on Invertebrate Paleontology. University of Kansas Press and Geological Society of America, Lawrence, C (1-2), 900 p.
Murray, J.W. 1974. Distribution and Ecology of Living Benthic Foraminiferids, Heinemann Educational Books, London, 274 p.
Snyder, S.W. 1988. Micropalaeontology of Miocene sediments in the shallow subsurface of Onslow Bay, North Carolina continental shelf. Cushman Foundation for Foraminiferal Research, Special Publication, 25: 1-189.
ACKNOWLEDGMENTS
Many thanks to Judy Scotchmoor for facilitating the completion of this
contribution.
CLASSROOM ACTIVITY
INTRODUCTION
Grade Level: Grades 10-16
Purpose: This activity will help students to have a better understanding of how scientists can use foraminifera to interpret past environments. Specifically, the students will have the opportunity to understand one of the basic tenets of geology the present is the key to the past , a principle otherwise known as uniformitarianism.
Objectives: Following this activity, students should be able to:
a) Distinguish between planktonic and benthic foraminifera.
b) Distinguish between hyaline, porcelaneous and agglutinated foraminifera.
c) Calculate the proportion of planktonic specimens in a sample.
d) Establish the species diversity of a sample.
e) Establish the shell-type ratio of a sample.
f) Reconstruct the environment of deposition of the sample.
g) Find oil (just kidding!).
Return to top
MATERIALS
If you live by the sea you can collect live or dead foraminifera from the
surface of mud or sandflats exposed in estuaries or lagoons at low tide. Sandy beaches are the marine versions of deserts: the sediment is so well-sorted by wave action that there is little food for foraminifera and so few species live there. You can, however, often find the shells of dead
forams concentrated in the troughs between ripple crests. You can collect
samples from these modern environments and ask the students to analyze the foram assemblages and to reconstruct the environment of deposition.
If you live inland then you will need to collect samples of sediment or rock
containing foraminifera. Although the fossil record of forams stretches back to the Cambrian, Cretaceous or Cenozoic material would be the best for you to work with because the farther back in geologic time one goes the greater the differences between fossil and modern assemblages — thus it becomes more difficult to apply the concept of uniformitarianism.
PROCEDURES
1) Choose the preparation technique (from those described in the earlier
chapter) most suited for the kind of sediment or rock that you have collected. Unconsolidated fine-grained rocks are the easiest to work with because little disaggregation is needed and the finer the sediment the fewer the sand grains for you to pick through in your search for foraminifera.
2) Once the sample is disaggregated, wash it over a fine mesh sieve (240 m) to remove all the silt and clay (you can use a 125 m mesh sieve but the smallest forams will be lost).
3) The material remaining on the sieve should be transferred to an
evaporating dish and oven or air-dried. The dried sediment should then be poured into a cone-shaped pile on a piece of paper. Use a sharp knife to divide the sediment into halves, quarters, eighths, etc., until you have a small enough portion to pour onto a picking tray so that no sediment grains
cover other grains.
4) You now need to pick a set number of forams from the tray. If time is
short pick 50, otherwise pick 100 specimens. In scientific studies 300 specimens are usually picked. There is nothing magic in this number. It is an arbitrary stopping point above which additional rare species are encountered more and more infrequently. Make sure that you pick a
representative suite of specimens. That is, do not pick only large specimens, or only small ones, or only pretty ones. The best way to do this is to mark your picking tray with a numbered grid. Then use a random numbers table to select a square. Pick all the specimens from that square and then select a second square. Continue this process until your target
number is reached and the specimens have been transferred to a gum
tragacanth-coated cardboard slide.
5) Sort the specimens into planktonic and benthic categories.
6) Count and calculate the proportion of planktonic specimens (percent
planktonics).
7) Sort the benthic specimens into three groups based on their shell
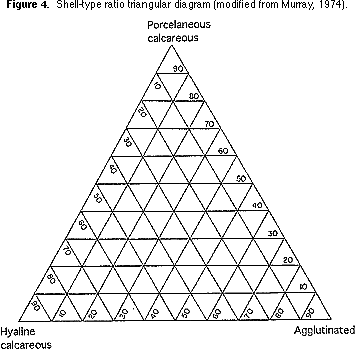
types. Count the number of specimens in each group and plot on a shell-type triangular diagram (Figure 4).
8) Sort the specimens in each group into morphological classes
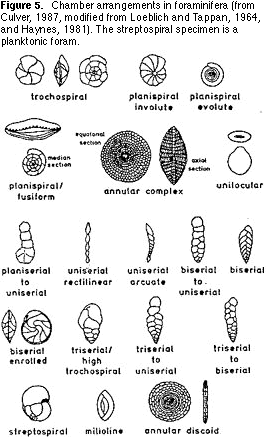
(morphospecies). This is easier said than done. The simplest way to approach this process is first to sort on the basis of chamber arrangement: single chambered or multichambered; straight or coiled; coiled on a
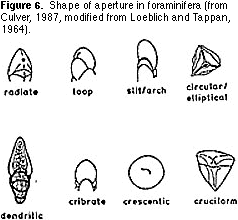
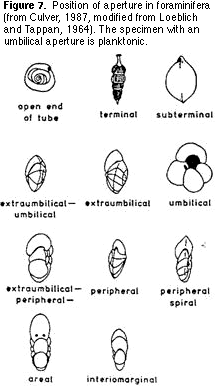
single plane or coiled in a conical shape (Figure 5). Then sort the resulting groups on the basis of the shape and location of the aperture (Figures 6, 7) — the hole(s) on the last chamber from which the cytoplasm extrudes as fine strands (filopods) during life (Figure 1). Finally,
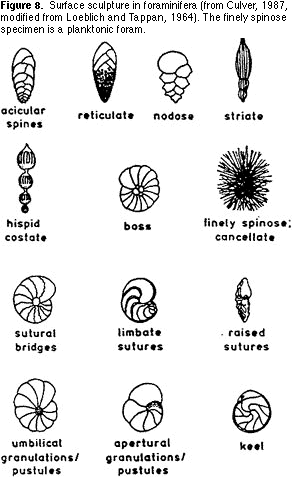
sort the morphological groups on the basis of the surface sculpture
(ornamentation) on the shells (Figure 8). This can be in the form of ribs, pits, spines, keels, striations, etc., often with several types of surface sculpture on one shell.
Return to top
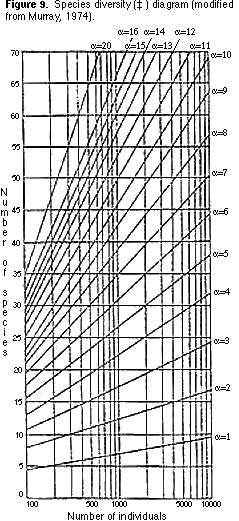
9) You can now count the number of morphological groups that you have recognized. This number is one measure of species diversity, the number of species (S) per standard-sized sample. Another measure of species diversity (which allows you to compare samples containing different numbers of specimens) is ‡. You can find the value of ‡ by plotting your sample on Figure 9.
INTERPRETIVE QUESTIONS
1) Plot your percent planktonics value on Figure 10. What water depth is indicated by this value?
2) Transfer your plot of the shell-type ratio onto Figure 3. What environments are indicated by the plot?
3) Transfer the plot that gave you the value for ‡ (Figure 9) onto Figure 11. What
environments are indicated by the plot?
NB. At this point the taxonomic approach would be used to refine your
paleoenvironmental interpretation. But this is beyond the scope of this exercise.
4) If you know the environmental provenance of your sample, compare the results of your analyses that might have caused inaccurate results.
5) If you do not know the environmental provenance of your sample, do
you think your interpretation is reliable? Would you feel confident to recommend drilling a $1 million well based on your interpretation? (Remember, your job is on the line.) How could you improve the accuracy of your paleoenvironmental reconstructions?
6) Imagine that sea level rose by 100 m immediately following deposition of the sediment containing your foraminiferal assemblage. Predict the expected characteristics of the subsequent foraminiferal assemblage.
Return to top Back to text Back to text
Return to topBack to text
Return to topBack to text
Return to topBack to text

|